DCTA Recognized for Ensuring Financial Transparency

The Denton County Transportation Authority's commitment to financial transparency has earned a Traditional Finances star from the Texas Comptroller. This award recognizes governmental agencies that provide allowable access to financial data, including all spending and revenue information within the agency.
The DCTA’s consistent dedication to ensuring transparency of the Authority’s financial records has earned high marks at both the state and national level. Learn more about transparency qualifications.
The DCTA also has been recognized by the Government Finance Officer Association of the United States and Canada with a Certificate of Achievement for Excellence in Financial Reporting. The Certificate of Achievement is the highest form of recognition in the area of governmental account and financial reporting. DCTA has been awarded the Certificate of Achievement for Excellence in Financial Reporting Program by Government Finance Officers Association.

The DCTA has also been awarded the Distinguished Budget Presentation Award by the Government Finance Officers Association for 19 consecutive years. The Distinguished Budget Presentation Award ensures that DCTA submits a high-quality budget which focuses on budgetary transparency and accountability within the agency. By receiving this award, DCTA is meeting guidelines established by both the National Advisory Council on State and Local Budgeting and the Government Finance Officers Association.

Finance Summary
The financial detail below is related to the fiscal year ended September 30, 2024 and includes the past six fiscal years for comparison when applicable. The per capita base is calculated using Denton population numbers and is detailed below:
| 2018 | 2019 | 2020 | 2021 | 2022 | 2023 | 2024 | |
|---|---|---|---|---|---|---|---|
| Population | 843,260 | 873,220 | 906,422 | 933,220 | 950,660 | 1,006,492 | 1,036,720 |
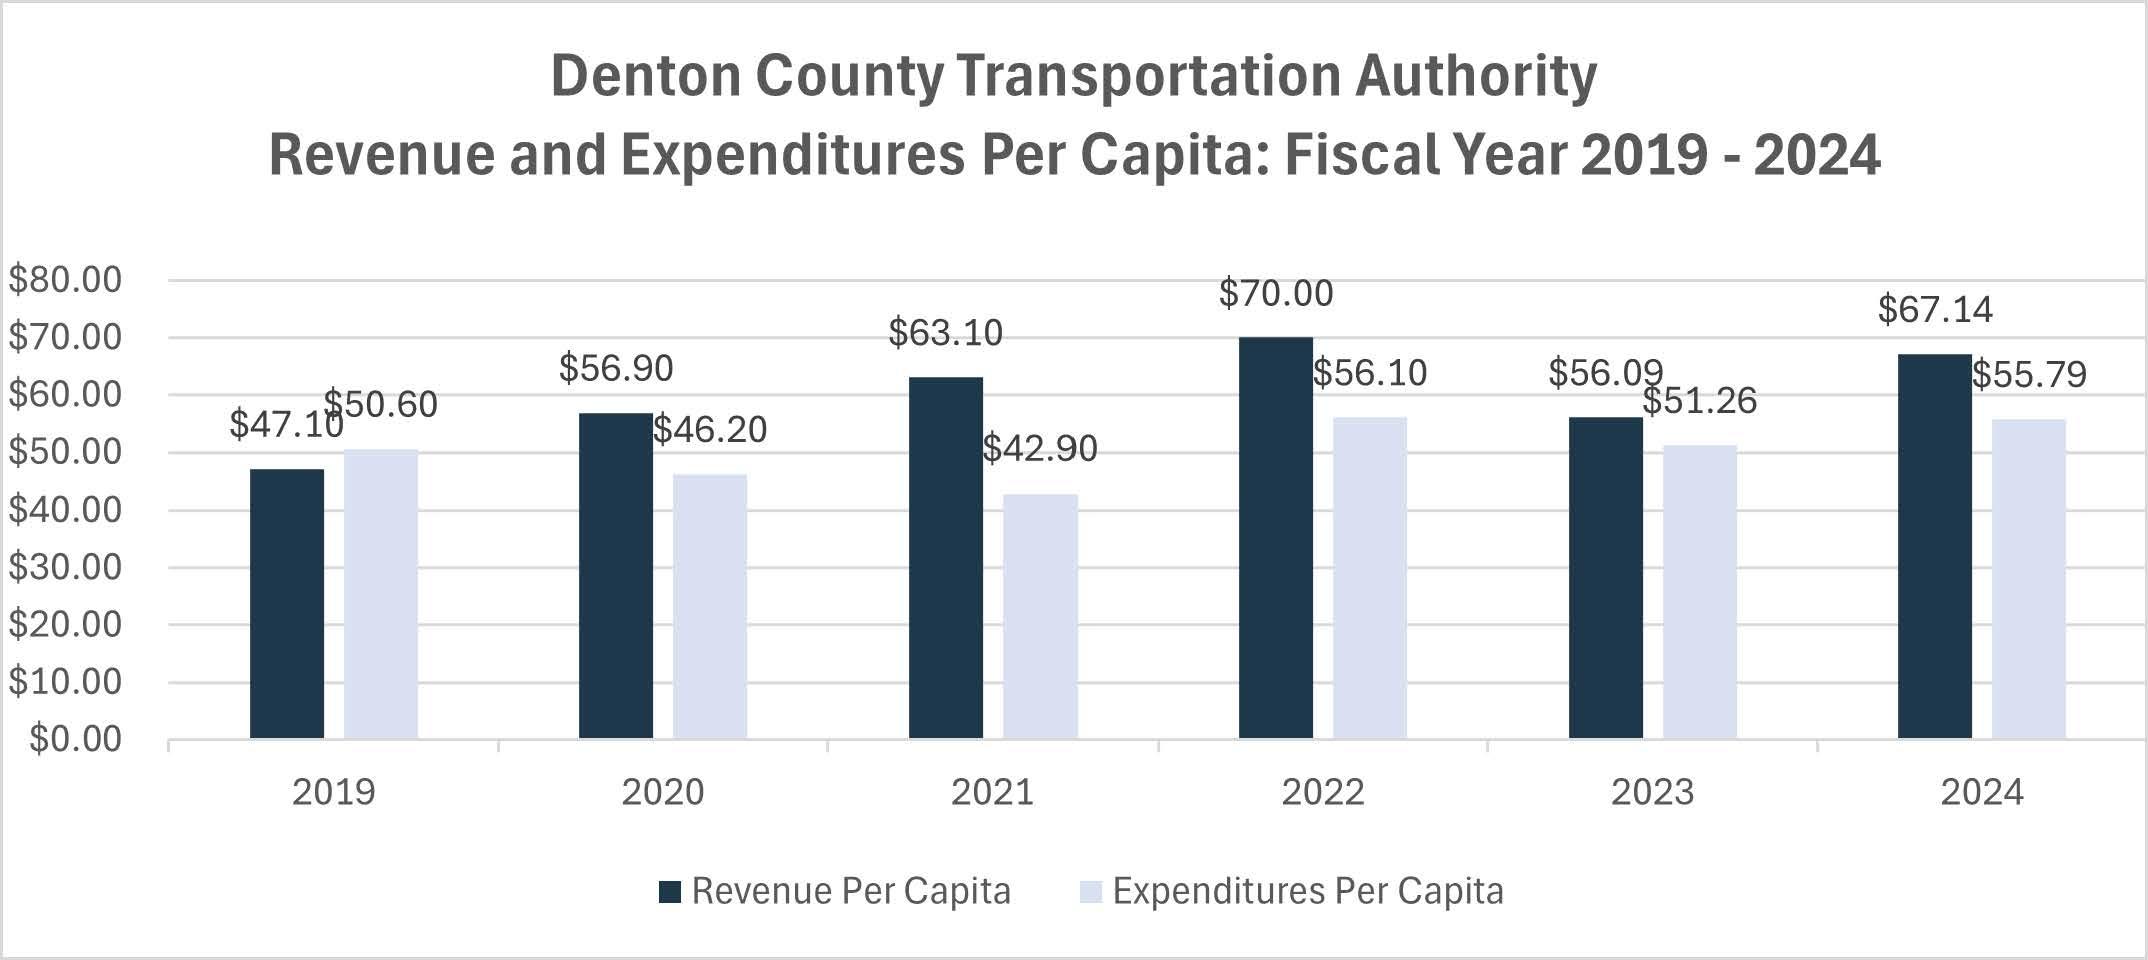
Revenues and Expenses per Capita (Last Seven Fiscal Years)
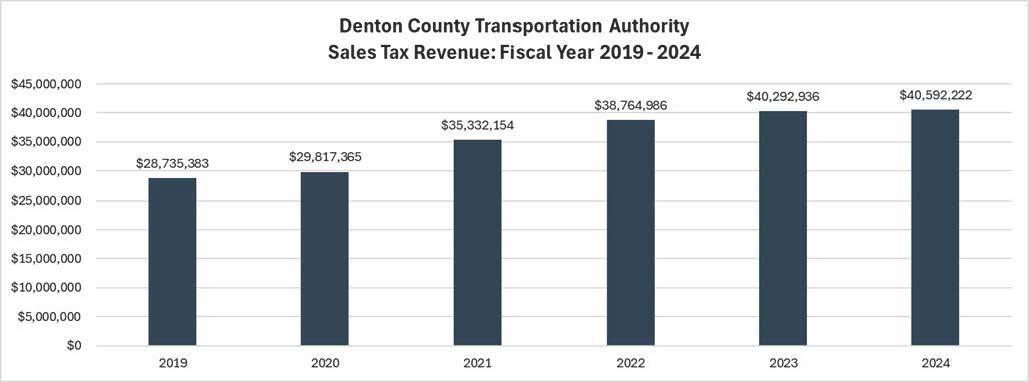
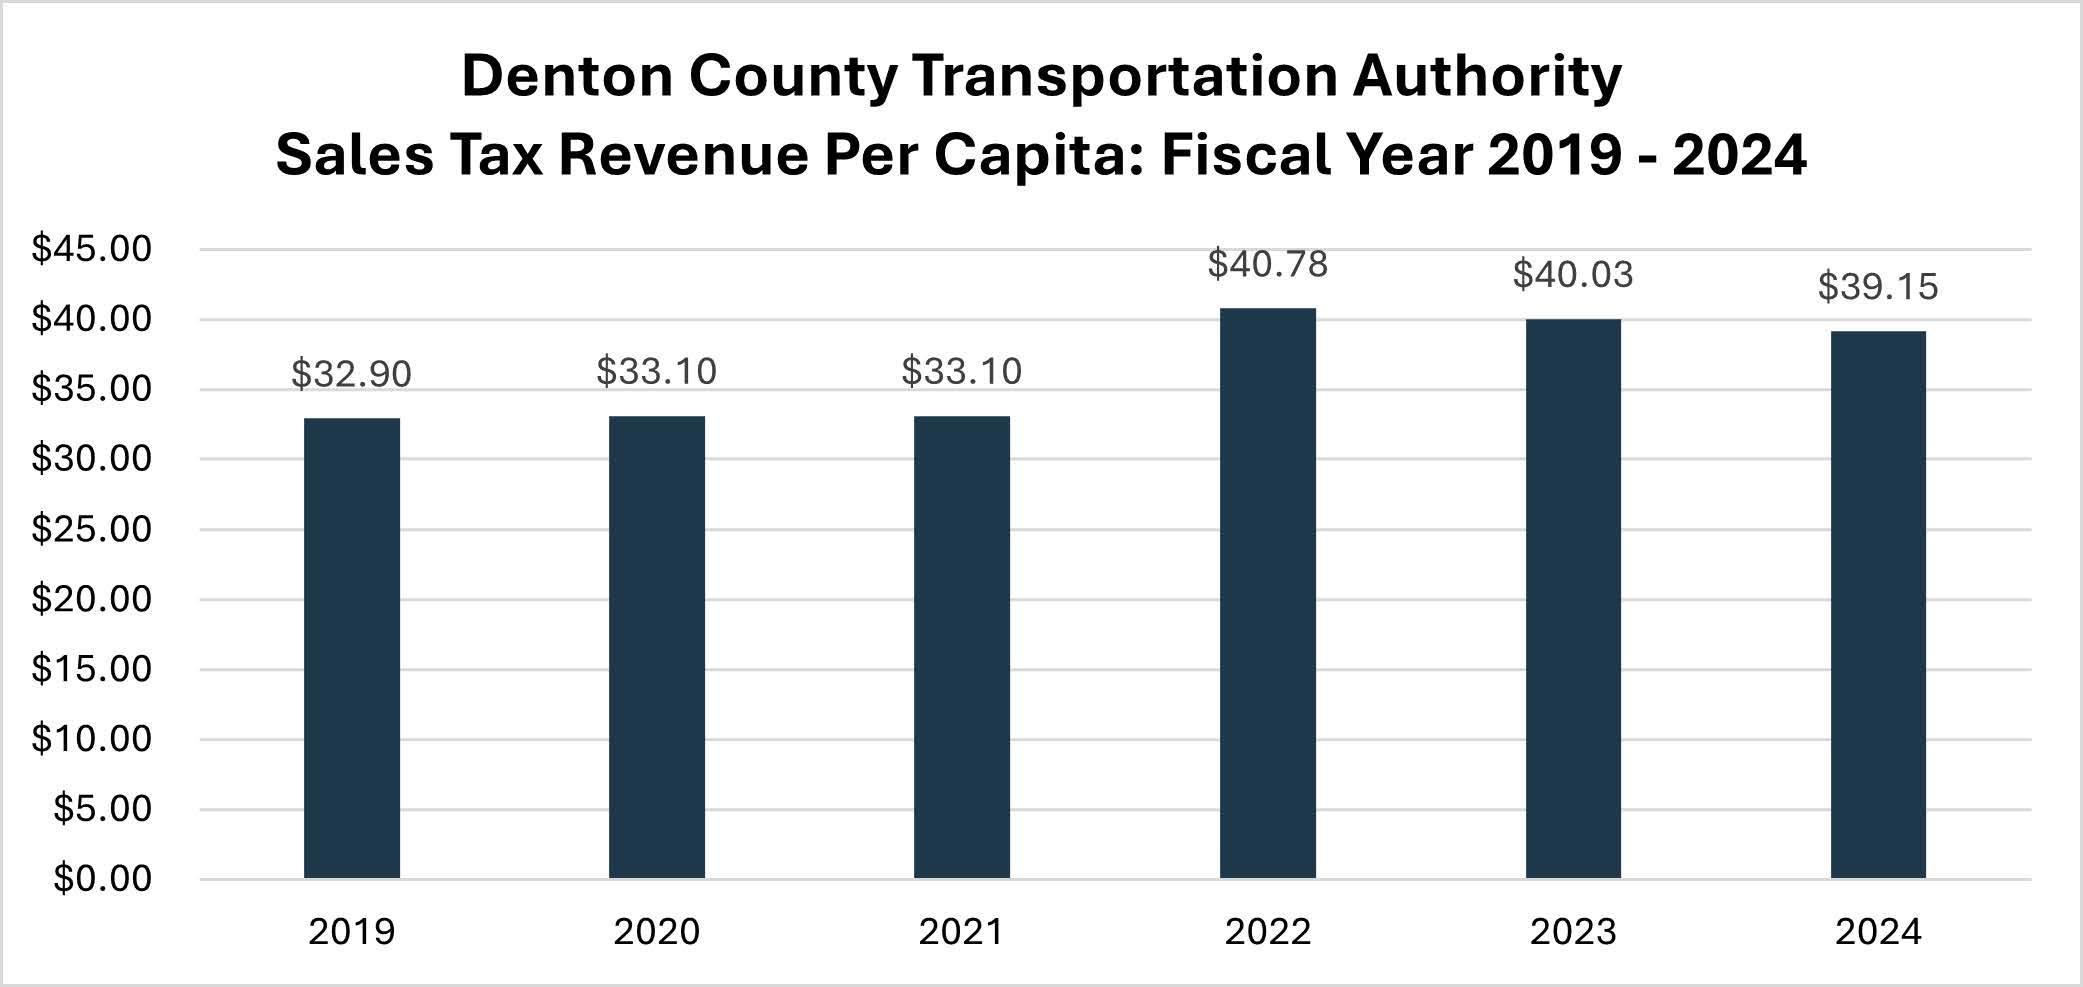
NOTE: DCTA does not receive income from property taxes. Sales tax is collected through a one-half percent sales tax from DCTA's three member cities - Denton, Highland Village and Lewisville.
| 2018 | 2019 | 2020 | 2021 | 2022 | 2023 | 2024 | |
|---|---|---|---|---|---|---|---|
| Revenue Per Capita | $46.0 | $47.1 | $56.9 | $63.1 | $70.00 | $56.09 | $67.14 |
| Expenditures Per Capita | $48.4 | $50.6 | $46.2 | $42.9 | $56.10 | $51.26 | $55.79 |
| Sales Tax Per Capita | $33.1 | $32.9 | $33.1 | $37.9 | $40.78 | $40.03 | $39.15 |
Revenues
| 2018 | 2019 | 2020 | 2021 | 2022 | 2023 | 2024 | |
|---|---|---|---|---|---|---|---|
| Revenue | $38,811,540 | $41,169,210 | $51,300,491 | $58,897,658 | $66,565,175 | $56,540,523 | $69,607,121 |
| Revenue Per Capita | $46.0 | $47.1 | $56.9 | $63.1 | $70.02 | $56.09 | $67.14 |
| Sales Tax Per Capita | $33.1 | $32.9 | $33.1 | $33.1 | $40.78 | $40.03 | $39.15 |
| 2018 | 2019 | 2020 | 2021 | 2022 | 2023 | 2024 | |
|---|---|---|---|---|---|---|---|
| Operating Revenue | $5,389,383 | $5,769,167 | $4,639,923 | $3,931,563 | $5,331,307 | $6,725,842 | $7,377,740 |
| Sales Tax Revenue | $27,937,707 | $28,735,383 | $29,817,365 | $35,332,154 | $38,764,986 | $40,292,936 | $40,592,222 |
| Operating Assistance Grants | $5,484,450 | $6,664,660 | $16,843,203 | $19,633,941 | $22,468,882 | $9,431,745 | $12,408,517 |
| Total | $38,811,541 | $41,169,210 | $51,300,491 | $58,897,658 | $66,565,175 | $56,450,523 | $60,378,479 |
Expenses
| 2018 | 2019 | 2020 | 2021 | 2022 | 2023 | 2024 | |
|---|---|---|---|---|---|---|---|
| Expenses | $40,852,280 | $44,204,389 | $41,604,129 | $40,020,204 | $53,329,698 | $51,588,096 | $57,839,112 |
| Expenditures Per Capita | $48.4 | $50.6 | $46.2 | $42.9 | $56.10 | $51.26 | $55.79 |
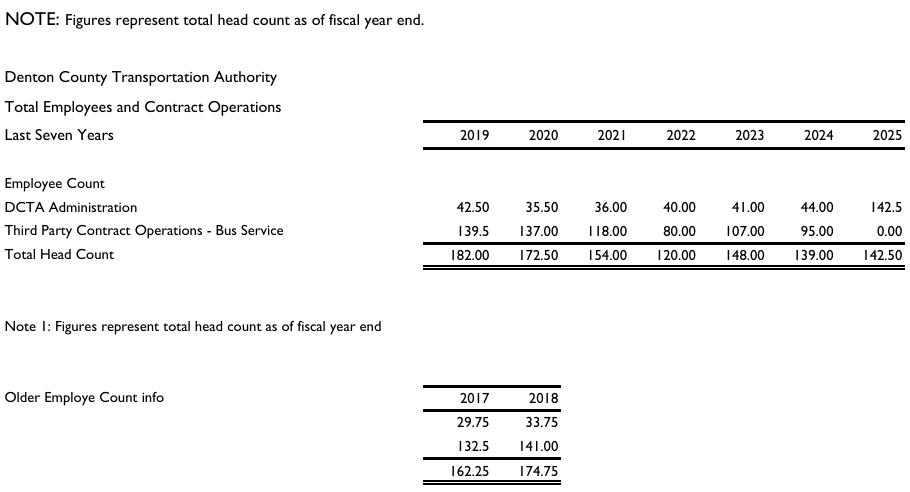
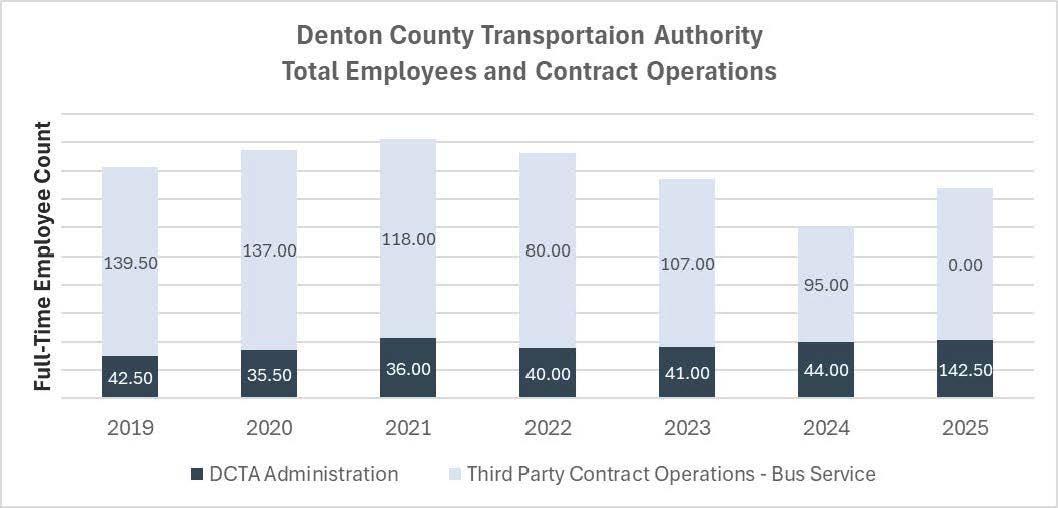
Total Employees and Contract Operations (Last Seven Years)
Header text
Header text
The budget is a policy tool used by staff and the Board to establish goals and deliver the services defined in the Service Plan of the agency, as well as serving as the foundation for DCTA’s long-range financial model. The budget identifies the source and use of funds expended by DCTA, communicates the priorities, and informs Denton County citizens about the financial condition of the agency.
Chapter 460 of the Texas Transportation Code requires the preparation of an annual budget for DCTA. The staff has prepared a balanced budget, where operating expenses and capital expenditure do not exceed the current year’s revenues and undesignated fund balance/reserves.
The proposed FY 2025 Budget was presented and discussed at the DCTA Budget Workshop on June 27th. On July 25th, the FY25 Proposed Budget was again presented to the Board of Directors at the Board meeting, in accordance with requirements under Chapter 460 of the Texas Transportation Code and DCTA Board policy and procedures, for Board review and comment as well as citizen input. Notice of the public hearing was published in the Denton Record Chronicle on August 7 & 8, 2024. The FY 2025 Operating & Capital Budget was adopted by the DCTA Board of Directors on August 22, 2024.
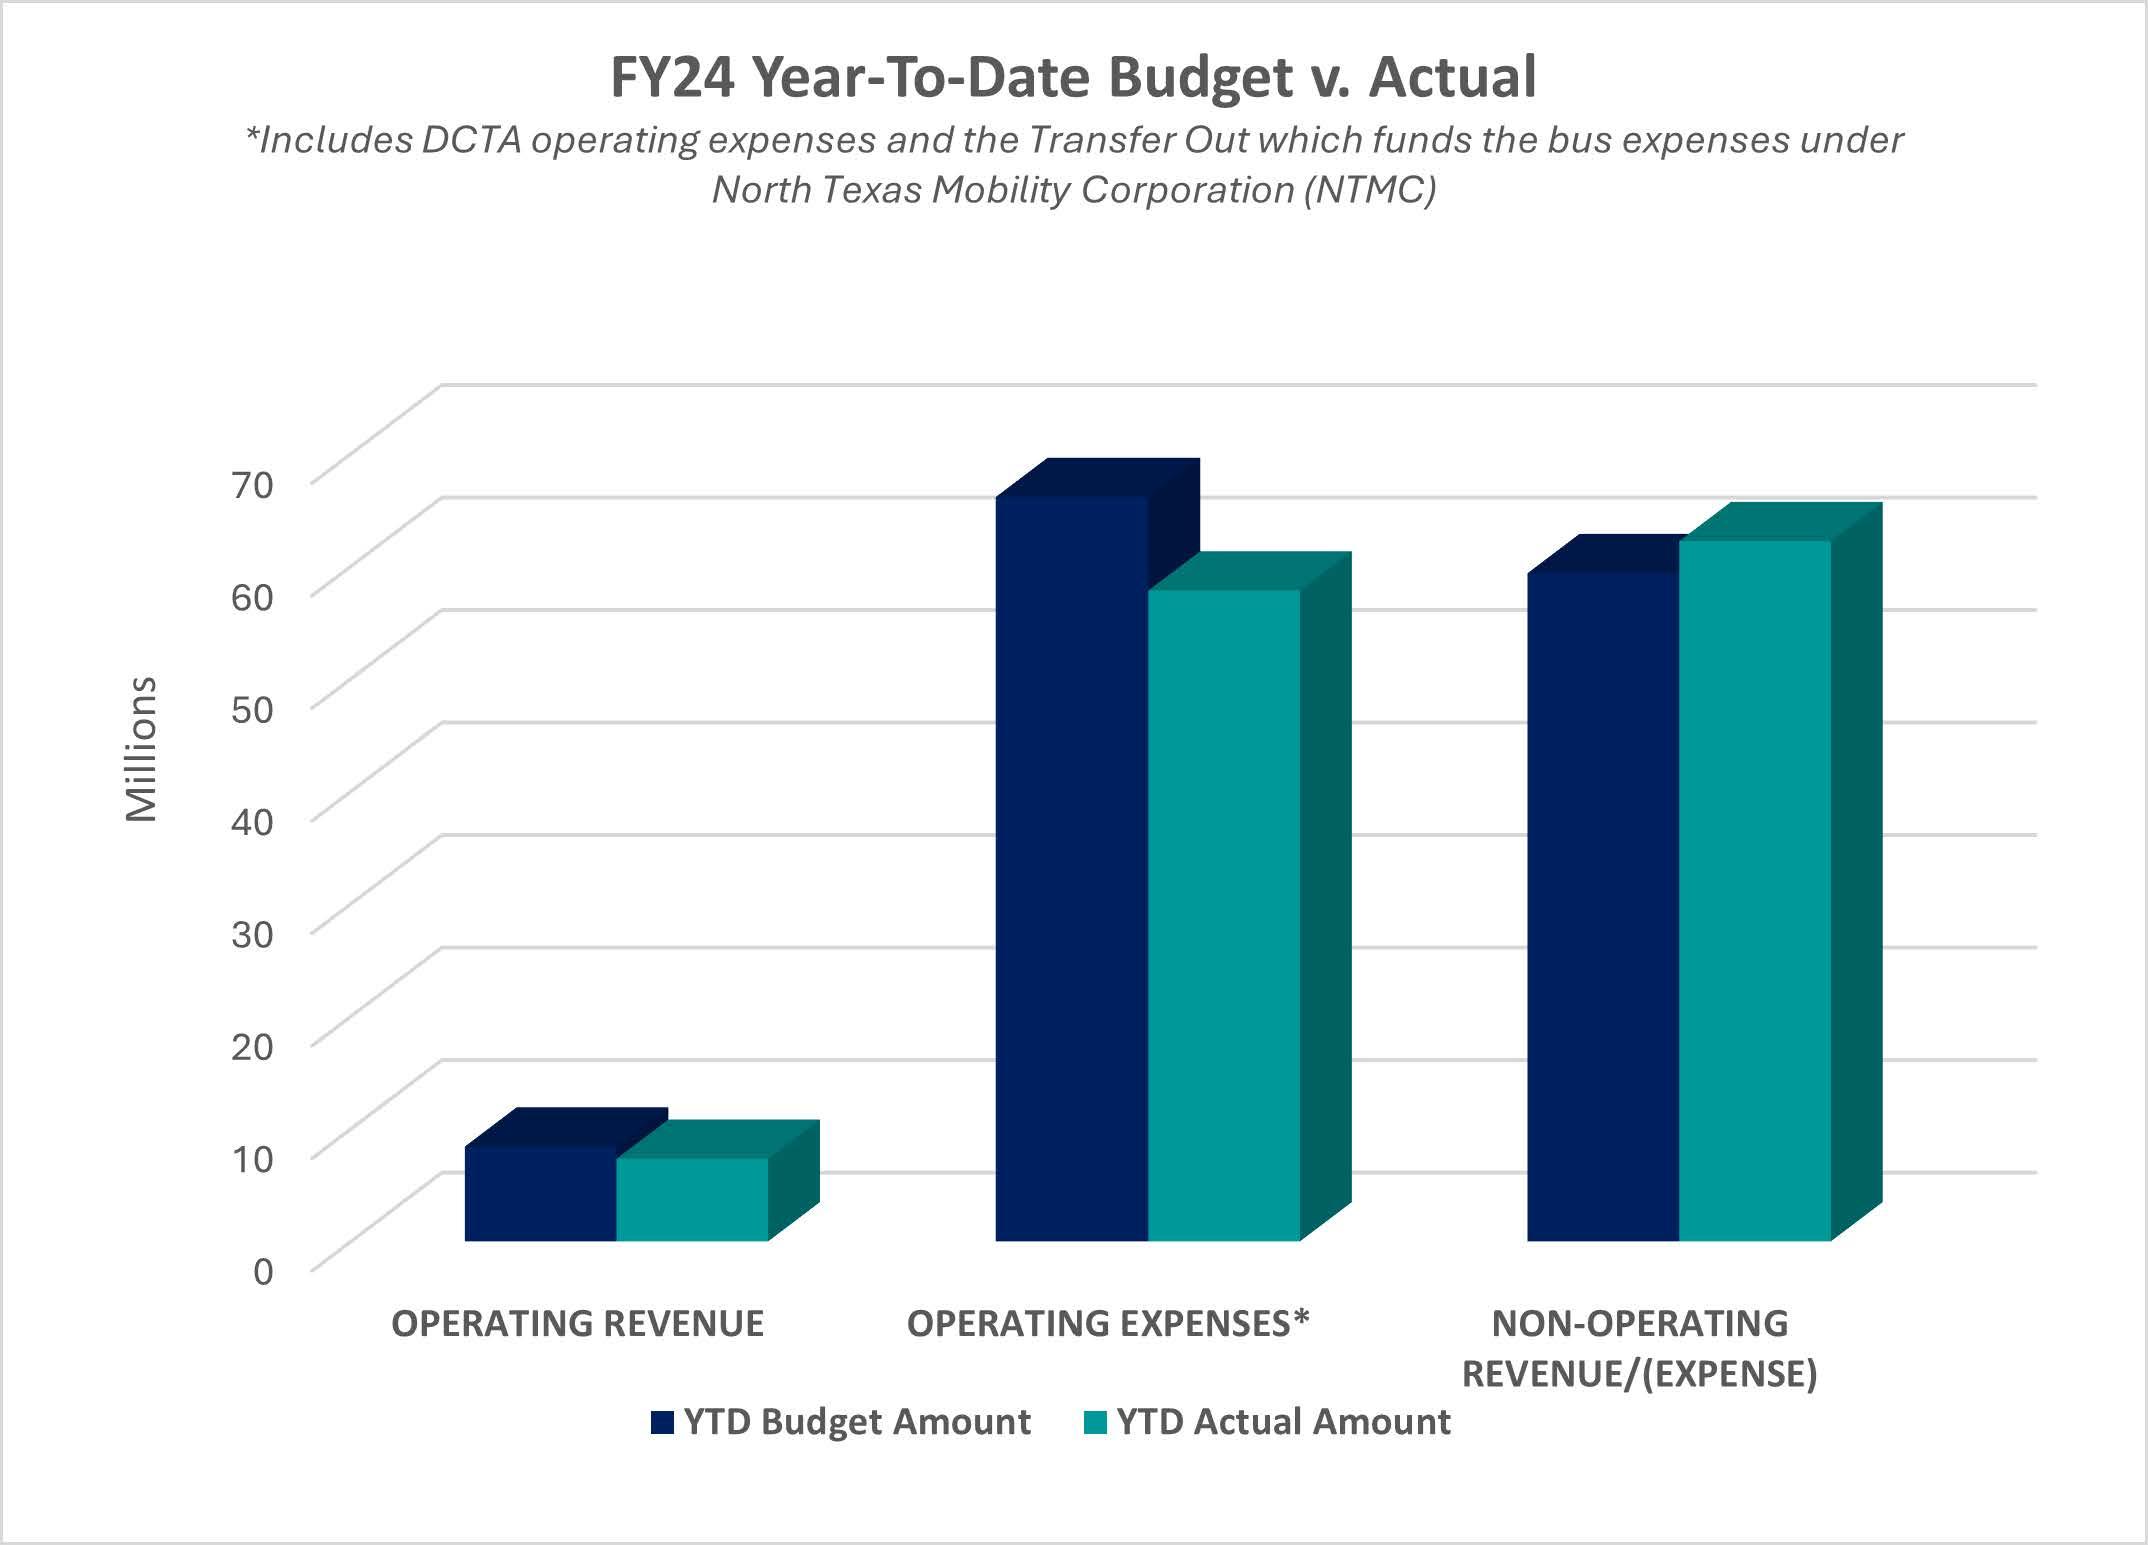
ADOPTED OPERATING & CAPITAL BUDGETS
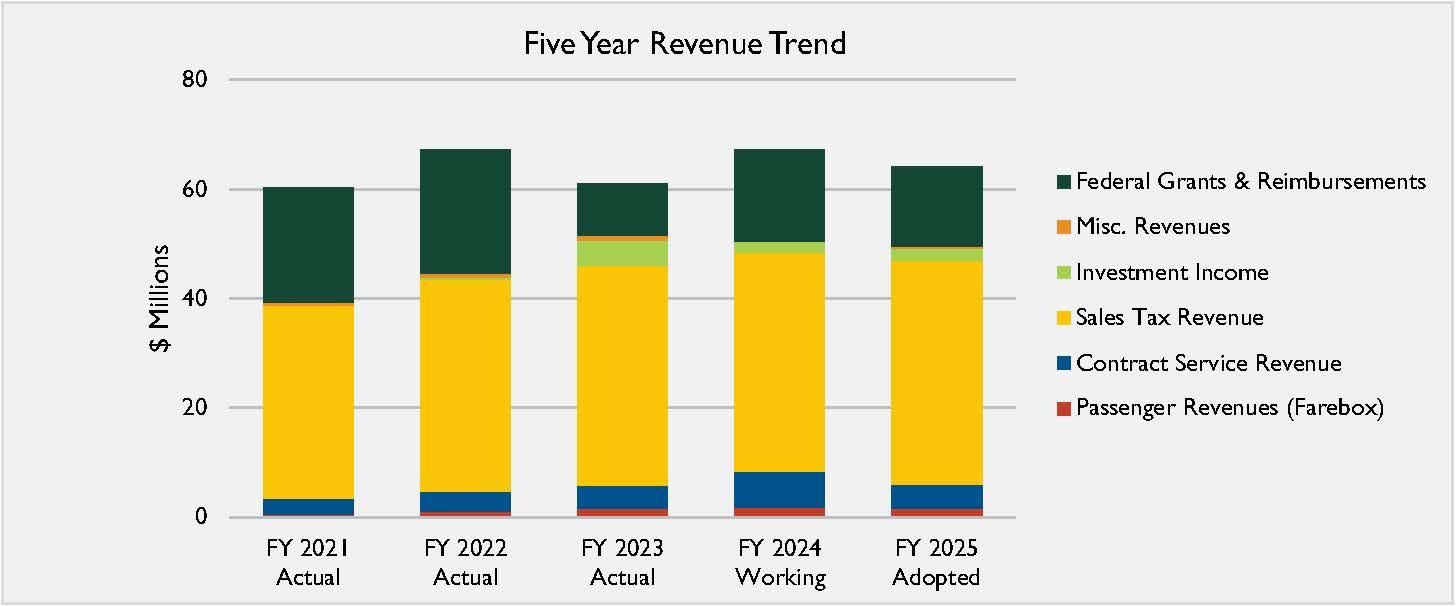
5 Year Revenue Trend
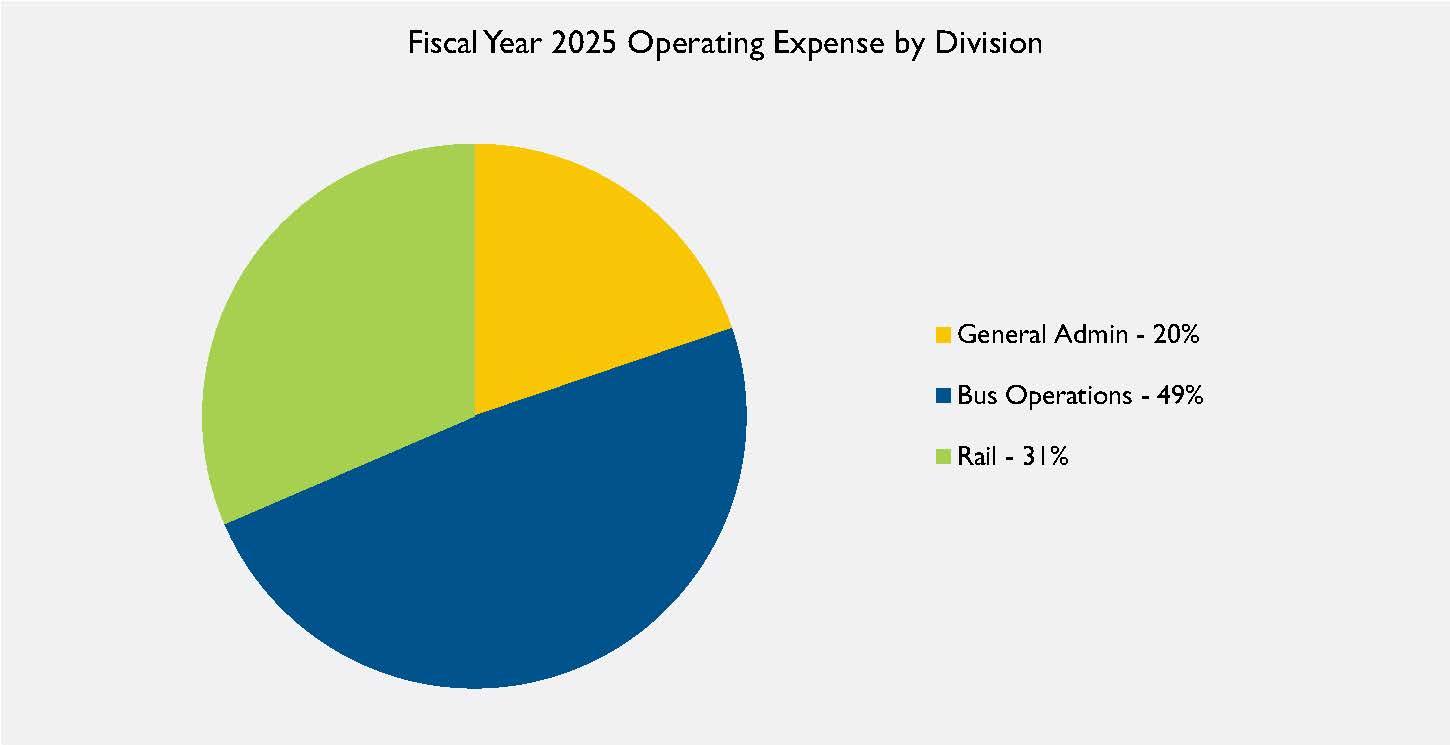
FY25 Operating Expense by Division
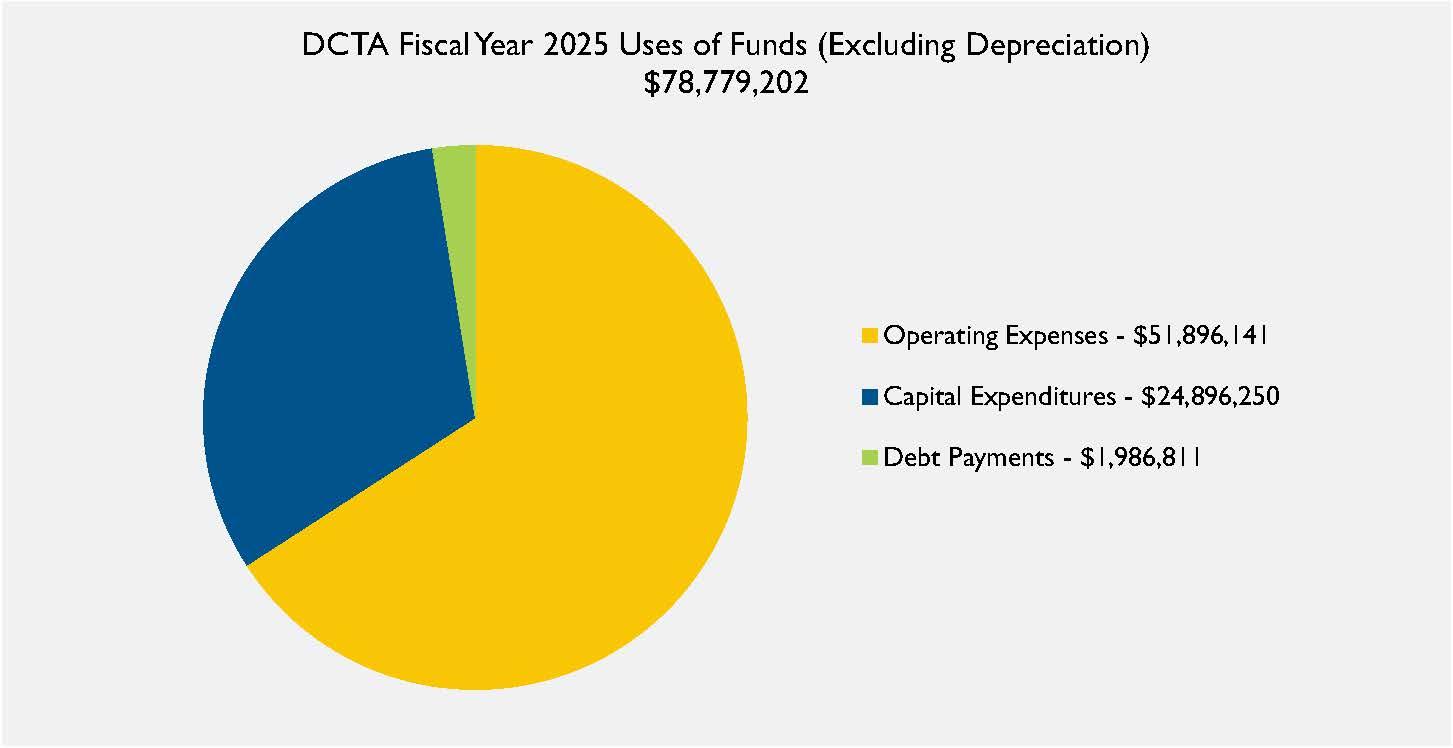
FY25 Uses of Funds
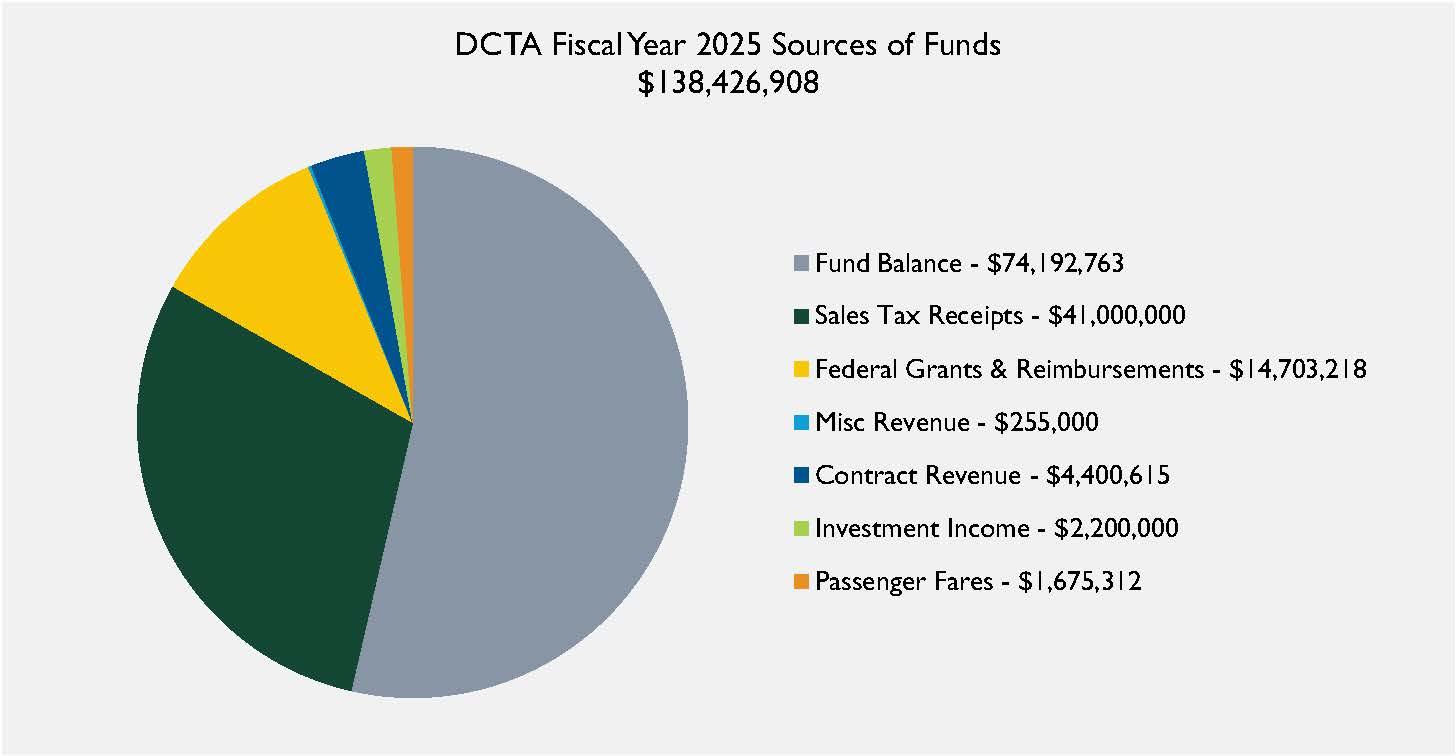
FY25 Sources of Funds
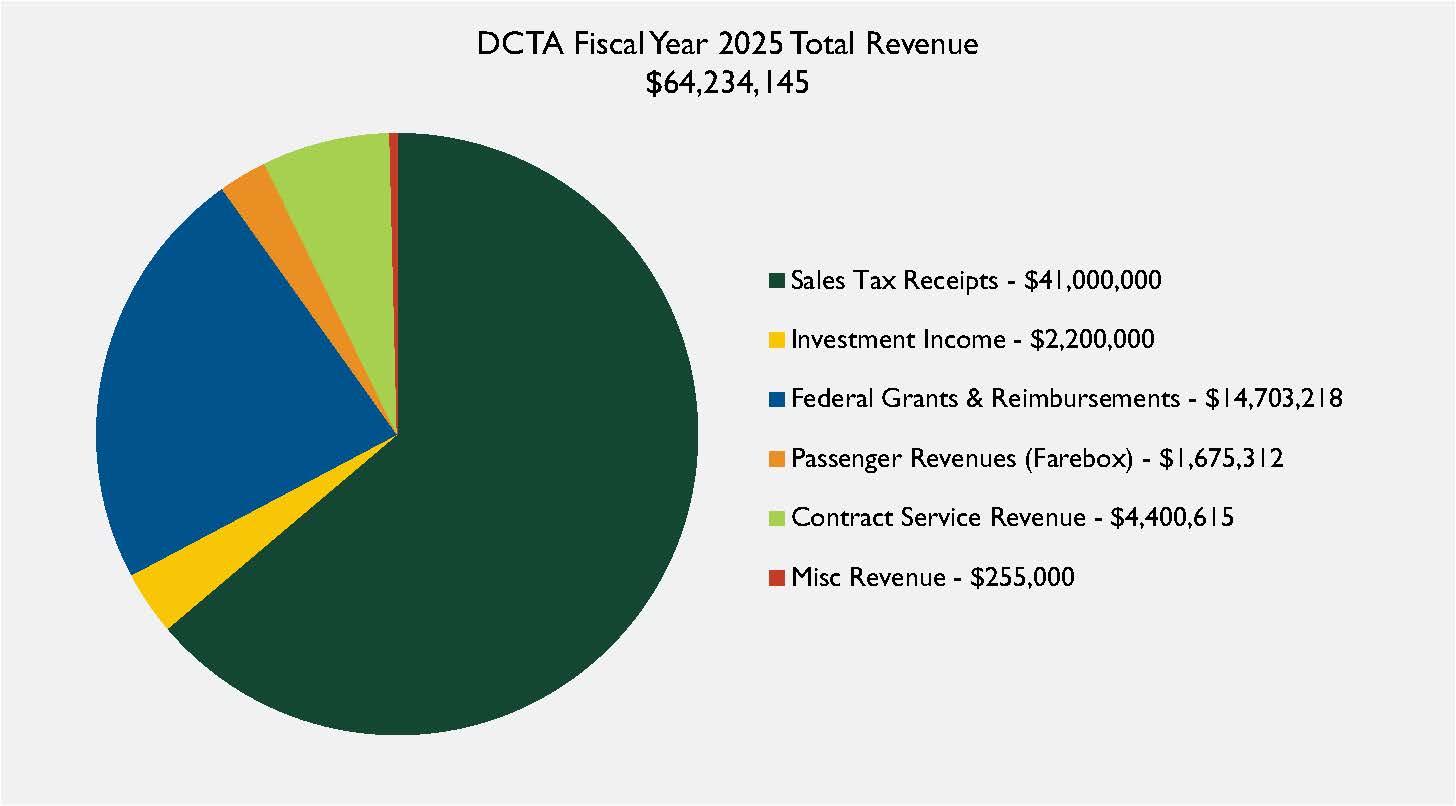
FY25 Total Revenues
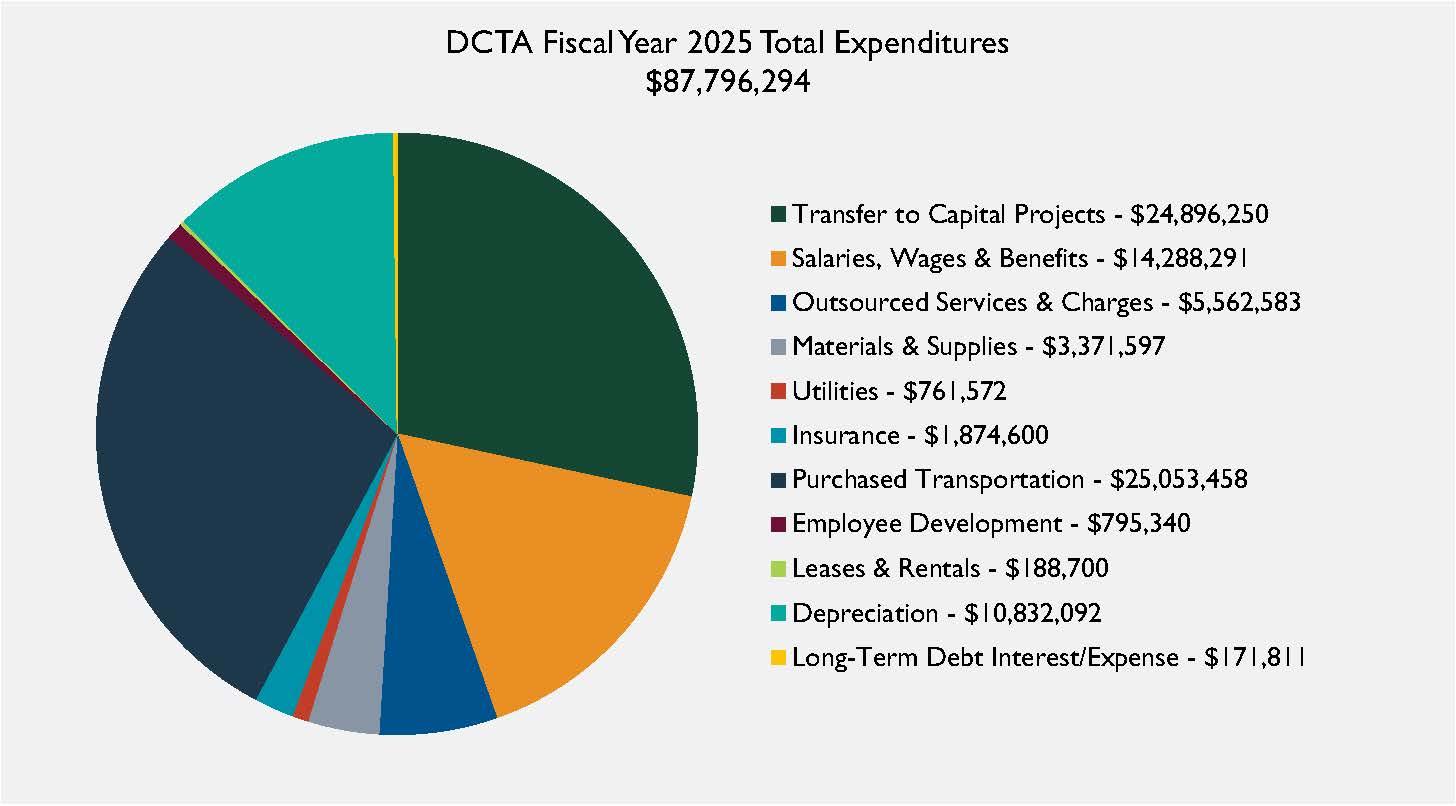
FY25 Total Expenditures
This report provides a quantitative look at the operating success, financial health, and compliance of the government report units. It includes a statement of net position, a statement of changes in financial position, a cash flow statement, and a comparison of budgeted to actual expenses and revenues.
FY 2024 Comprehensive Annual Financial Report
FY 2023 Comprehensive Annual Financial Report
FY 2022 Comprehensive Annual Financial Report
FY 2021 Comprehensive Annual Financial Report
FY 2020 Comprehensive Annual Financial Report
FY 2019 Comprehensive Annual Financial Report
FY 2018 Comprehensive Annual Financial Report
FY 2017 Comprehensive Annual Financial Report
FY 2016 Comprehensive Annual Financial Report
FY 2015 Comprehensive Annual Financial Report
FY 2014 Comprehensive Annual Financial Report
FY 2013 Comprehensive Annual Financial Report
FY 2012 Comprehensive Annual Financial Report
FY 2011 Comprehensive Annual Financial Report
FY 2010 Basic Financial Statements
FY 2009 Basic Financial Statements
FY 2008 Basic Financial Statements
FY 2007 Basic Financial Statements
Check Register (xlsx)
A check register is a listing of all payments incurred during a pay period by the Agency. The register includes payment date, payee, payment amount and a general description of the transaction. The information is compiled and totaled by monthly transactions. To adjust the month that is currently being viewed, use the drop-down selection in cell E1 of the Excel Document.
Texas Transparency Organization
The Texas Comptroller of Public Accounts' Texas Transparency website provides visitors with detailed information about state spending, datasets you can download and use, links to local government transparency efforts, and general information about the state budget process.
Debt Information
Summary information about outstanding debt including debt obligations, descriptions, dates issued, total amounts and maturity dates.
Current Tax Rates
DCTA collects a one-half percent sales tax in member cities – Denton, Highland Village and Lewisville.
Public Information Request
DCTA Board of Directors
DCTA General Contact Information
Customer Service
940.243.0077
604 East Hickory St. Denton, TX 76205
Hours of Operation
Monday through Friday: 7 a.m. - 7 p.m.
Saturday and Sunday: Closed
Administrative Offices
1955 Lakeway Drive, Suite 260
Lewisville, TX 75057
Mailing Address
P.O. Box 96
Lewisville, TX 75067
